Greenhouse gas emissions report 2020
STADS is up and running
STADS is once again up and running, and you can register for spring classes and exams. The registration deadline is Thursday 7 November at 23.59.
This page is a summary of Arhus University's 2020 greenhouse gas emissions report. Click the bar at the top right to read the whole report.
Aarhus University greenhouse gas emissions report 2020 – summary
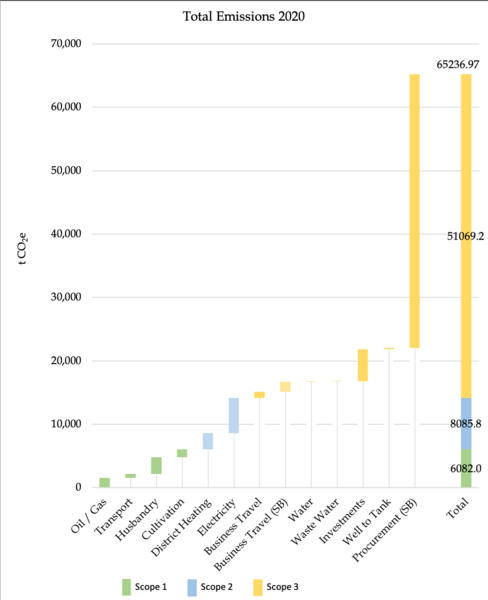
In 2020, Aarhus University’s total carbon emissions amounted to 65,237 t CO2e. This represents a 40% reduction in the university’s carbon emissions over 2019 with regard to comparable parameters. To a great extent, this reduction may be attributed to the impact of the Covid-19 pandemic on the university’s operations.
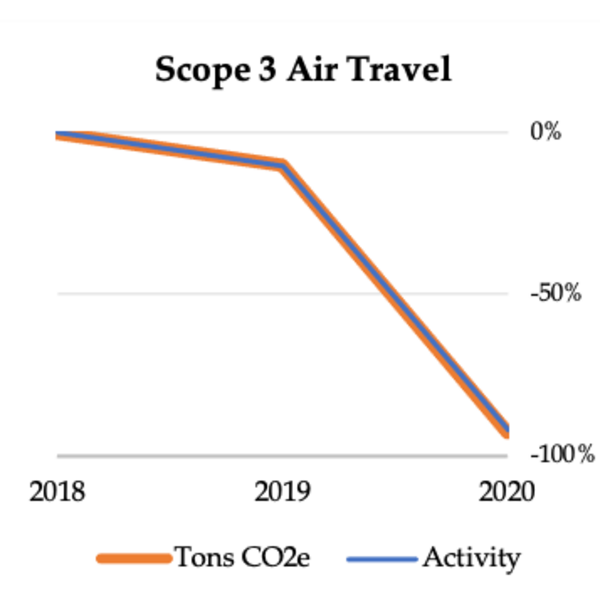
One significant contributing factor was a dramatic drop in travel activity, particularly in regard to carbon emissions from air travel. In 2018 and 2019, air travel accounted for approx. 40% of total carbon emissions, while in 2020 they accounted for only 4.5% when the accounts are assessed on the basis of the same parameters as in 2019, as the number of flights has declined significantly.
The consumption of electricity and heat in the university's buildings also decreased in 2020. However, due to changes in the energy mix (the primary energy sources) used by the electricity providers and heating plants which supply AU, this development – particularly in regard to heating – does not directly translate into reductions in carbon emissions. So while AU’s emissions from heating increased by 42%, emissions from electricity consumption fell by 24%.
New method of calculation in 2020
To a large extent, the figures in AU’s GHG emissions reports are comparable from year to year. At the same time, as methods of calculation are refined and new data becomes available, AU’s reports will be expanded and adjusted. This means, there will be additions to this account which have not been in previous years, and therefore cannot be compared back in time.
As compared with the GHG emissions report for 2019, the 2020 report has been expanded to include more elements in Scope 3, due to the introduction of a new method. As a consequence, it is now possible to add the following elements in the report: AU’s procurement of goods and services, some of AU’s investments, hotel stays and the indirect emissions associated with the extraction and transportation of fuel for transport purposes.
Methodological differences between 2020 and 2019 reports
- The method of calculating emissions for the original categories included in the 2019 report is process-based: a specific emission factor is correlated with the specific unit consumed (for example, kwh of electricity consumed).
- The method used for calculating emissions for the new categories included in this year’s report is consumption-based. This means that calculations are based on the amount of money the university has spent within different categories defined in the university’s accounting system. The amount spent within a specific category (such as IT hardware) is correlated with a relevant emission factor to calculate the carbon emissions from purchases within the category.
The advantage of the new method is that it is relatively easy to estimate carbon emissions for activities which it would otherwise be difficult to calculate on a large scale. This makes it possible for the university to identify its major sources of emissions. The disadvantage of this method is that the consumption-based method is less accurate than the process-based method. As a result, comparisons of emissions in specific categories in different years will be less accurate than comparable comparisons of emissions calculated using the process-based method. However, we expect that the consumption-based method will become more accurate in coming years.
As calculated using the consumption-based method, goods and services purchased accounted for 36% and 29% respectively of the university’s total carbon emissions in 2020.
Highlights from the 2020 GHD report
Biogas: AU’s consumption of biogas in 2020 increased over 2019. However, according to the UN climate panel IPCC, biogas does not emit CO2. The Danish Centre for Environment and Energy (DCE), which has drawn up the university's GHG emissions report, is closely monitoring the debate and it will correct the calculation method if the IPCC changes its perception. If this happens, it will have an impact on AU’s results.
District heating: AU’s carbon emissions from district heating increased in 2020, despite reduced heating consumption. This is because each heating plant has its own unique emission factor that depends on the mix of materials they burn to generate heat. In 2020, the emission factor for several heating plants was higher than in 2019, among other reasons because the energy mix included less waste.
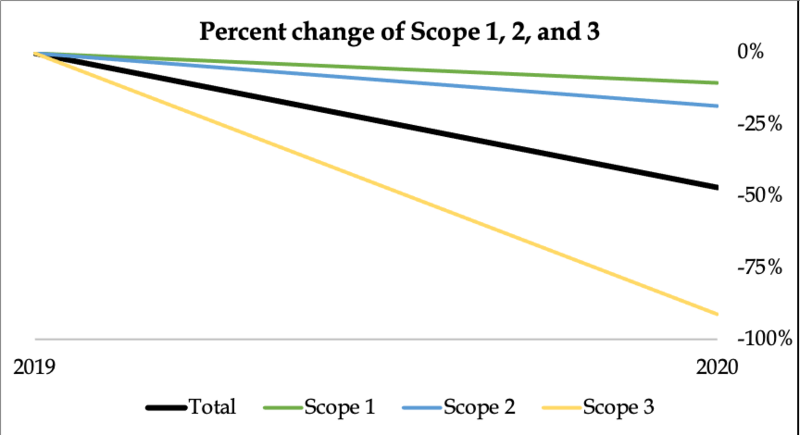
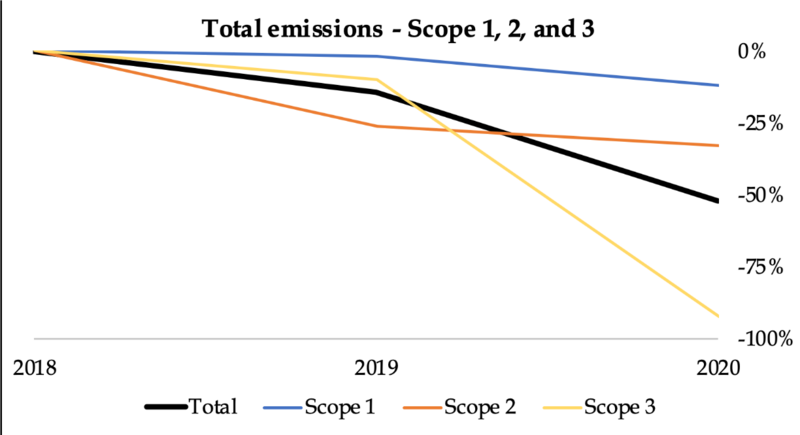
Visual comparison of 2019 and 2020
The models below show the trends in activity and CO2 emissions within scopes 1, 2 and 3 in 2019 and 2020 respectively.
Results for scope 1

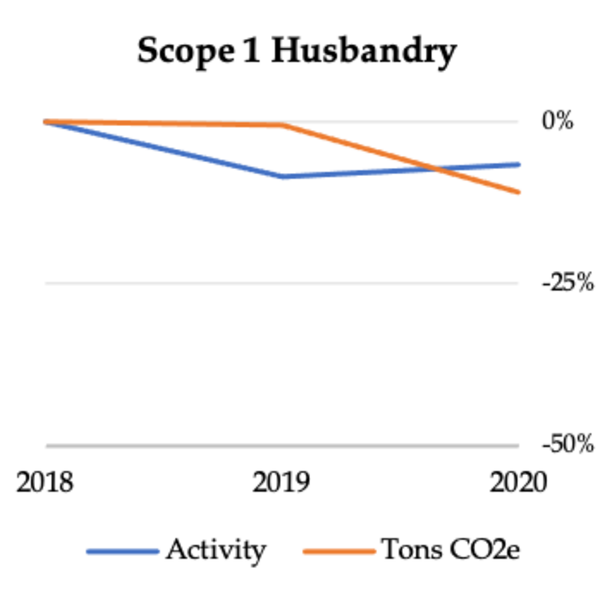
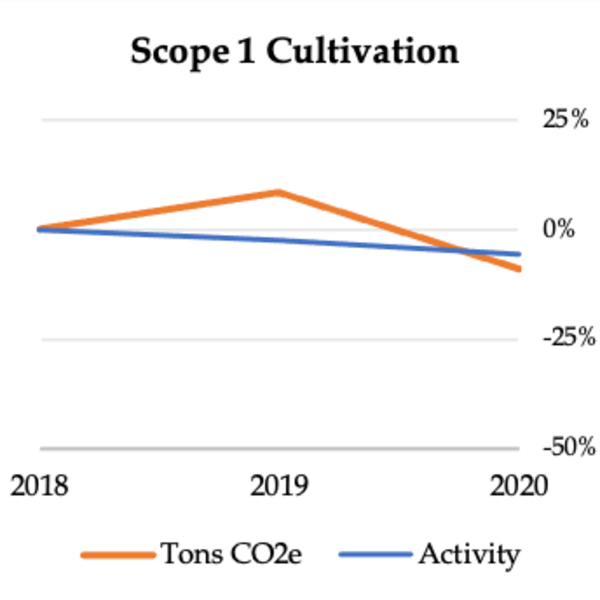
AU's CO2 emissions in scope 1 are based on data from the following sources:
- Power/heat production
- Transport: the research ship Aurora, AU vehicles (in terms of number of kilometres driven) + employee-owned vehicles (in terms of number of kilometres driven during working hours).
AU CO2 emissions in scope 1 = 6,082.0 tonnes CO2-eq
Results for scope 2
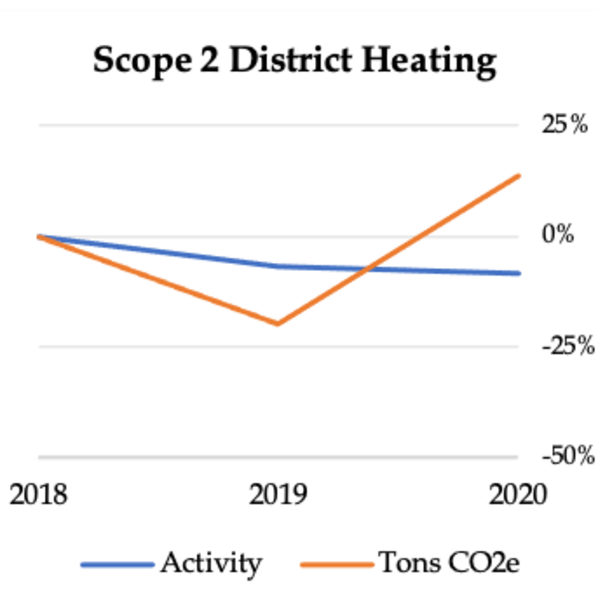

Scope 2 is general upstream emissions of energy and is based on data from the following sources:
- Heating
- Electricity
- Cooling
AU CO2 emissions in scope 2 =8,085.8 tonnes CO2-eq
Results for scope 3
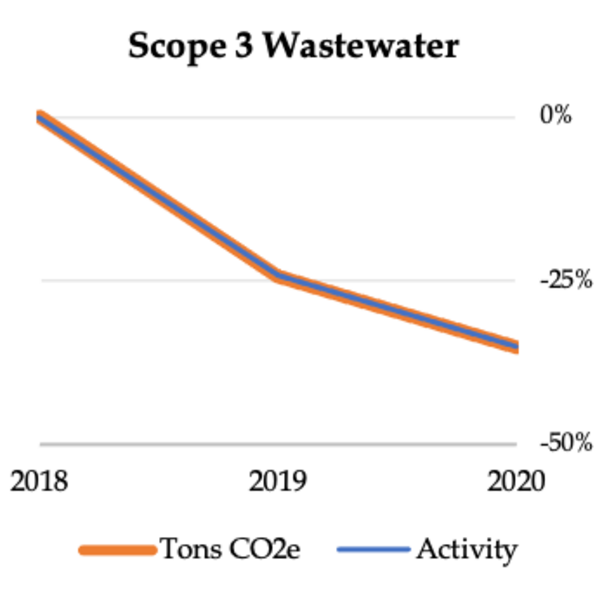

Scope 3 includes all upstream and downstream indirect emissions from AU and constitutes a large and complex share of the total CO2 inventory for all enterprises, including AU. This means it is not possible to calculate scope 3 as precisely as scopes 1 and 2. However, progress is being made.
AU CO2 emissions in scope 3 = 51,069.2 tonnes CO2-eq .
Read more about how scope 3 is calculated in the box Aarhus Unversity’s GHD accounts 2020 - summary.
Greenhouse Gas Protocol
This approach is used by both companies and public institutions as a framework for determining the company's/institution's CO2 emissions. It is a globally applied and recognised method, and it is used by other universities all over the world. This method makes it possible to compare CO2 emissions across universities.
The Greenhouse Gas Protocol operates with three scopes. 5,000-7,000 companies and institutions use the tool globally. Fewer than 10% of them use scope 3.
Scope 1, 2 and 3
Aarhus University's GHG emissions report is based on the Greenhouse Gas Protocol (GHG Protocol), which is a recognised method of calculating emissions of greenhouse gases by converting them into CO2 equivalents divided into three so-called scopes:
- Direct emissions from the university's property, e.g. from boilers or combined heat and power production at AU, as well as in connection with the use of motor vehicles, operating the research vessel Aurora, or emissions from agricultural activities.
- Indirect emissions related to the university's purchase of heating, electricity and cooling, for example.
- Value-chain emissions, which include purchases and air travel.
AU is also collaborating with the other universities in Denmark to develop a common methodology for GHG inventories in the university sector. The objective is to develop a common methodology with associated guidelines.
CO2 equivalents
CO2 equivalents are a conversion factor for comparing the impact of different greenhouse gases on the greenhouse effect. It has been calculated how many tonnes of CO2 are required to cause the same greenhouse effect as one tonne of another gas. This figure is the gas's CO2 equivalent.